Sharpen Your Knowledge with Microsoft (PL-300) Certification Sample Questions
CertsTime has provided you with a sample question set to elevate your knowledge about the Microsoft Power BI Data Analyst exam. With these updated sample questions, you can become quite familiar with the difficulty level and format of the real PL-300 certification test. Try our sample Microsoft Power BI Data Analyst certification practice exam to get a feel for the real exam environment. Our sample practice exam gives you a sense of reality and an idea of the questions on the actual Microsoft Power BI Data Analyst Associate certification exam.
Our sample questions are similar to the Real Microsoft PL-300 exam questions. The premium Microsoft Power BI Data Analyst certification practice exam gives you a golden opportunity to evaluate and strengthen your preparation with real-time scenario-based questions. Plus, by practicing real-time scenario-based questions, you will run into a variety of challenges that will push you to enhance your knowledge and skills.
Microsoft PL-300 Sample Questions:
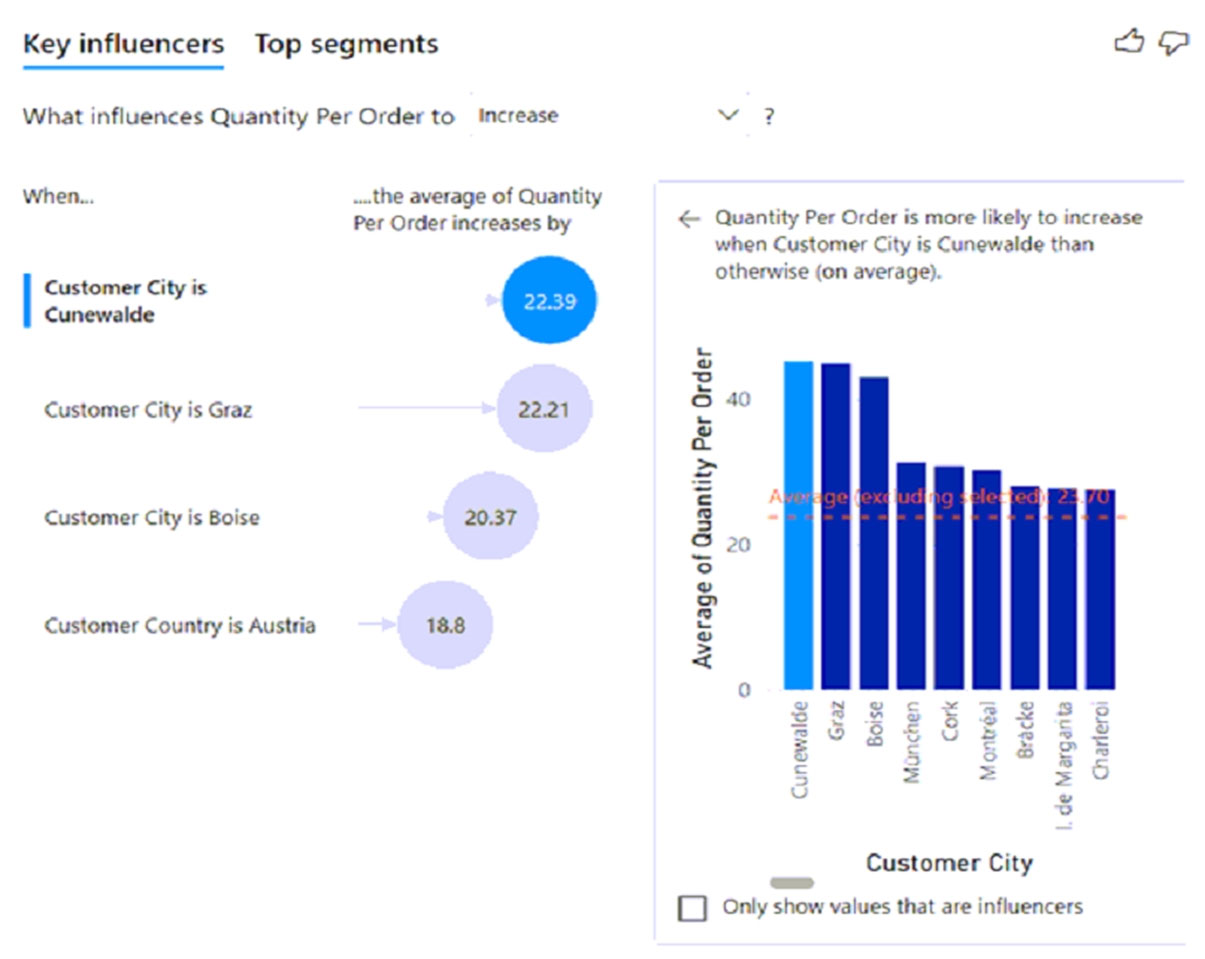
You are using the key influencers visual to identify which factors affect the quantity of items sold in an order.
You add the following fields to the Explain By field:
* Customer Country
* Product Category
* Supplier Country
* Sales Employee
* Supplier Name
* Product Name
* Customer City
The key influencers visual returns the results shown in the following exhibit.

What can you identify from the visual?
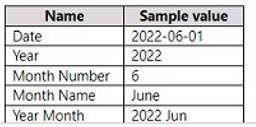
You have a Power B1 model that contains a table named Date. The table has the following columns.

You have a Power BI report named Report' and a dashboard named Dashboard'. Report1 contains a line chart named Sales by month.
You pin the Sales by month visual to Dashboard1.
In Report1, you change the Sales by month visual to a bar chart.
You need to ensure that the bar chart displays on Dashboard',
What should you do?
You have a Power Bl report named Report1 and a dashboard named Dashboard1, Report1 contains a line chart named Sales by month.
You pin the Sales by month visual to Dashboard1.
In Report1, you change the Sales by month visual to a bar chart.
You need to ensure that bar chart displays on Dashboard1.
What should you do?
You need to create a Power BI theme that will be used in multiple reports. The theme will include corporate branding for font size, color, and bar chart formatting.
What should you do?
Note: If there is any error in our Microsoft PL-300 certification exam sample questions, please update us via email at support@certstime.com.


 Try Before You Buy!